
In this article, we’ll show you how to use the gfknewron Market Product leaderboard.
The Product leaderboard allows you to review performance for the whole market, focus on segments of interest, take a closer look at specific models and their competitors, review priority KPIs, analyse longer-term trends and patterns, and segment your data to gain a deeper understanding of what’s driving performance.
Let’s get started.
1. Navigate to the Product leaderboard
Once you’ve logged into the gfknewron Market platform, click on ‘Products’ in the left-hand side menu to navigate to the Product leaderboard.

Your Product leaderboard will look like this:

2. Configure your Product leaderboard view
You’re able to configure your Product leaderboard view to unlock data and insights based on time frames, channels, brands, first activity, or features of interest.
2.1 Select a focus timeframe
First, use the top menu to set a focus timeframe. You’ll be given the option to set your timeframe in units of years, quarters, or months. If you have a subscription to weekly data, you’ll also have the option to set your timeframe in units of weeks.

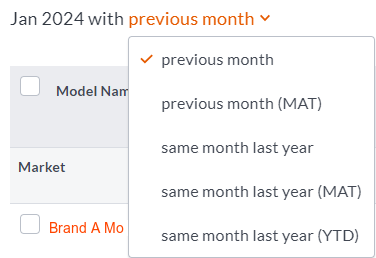
2.2 Select how you would like to compare data
- previous month
- previous month (moving annual total)
- same month last year
- same month last year (moving annual total)
- same month last year (year to date)
Select your preferred timeframe.
2.3 Select additional filters
Drill down into specific segments of interest by applying additional filter criteria. You can choose to filter your report according to the following categories:
- brand
- channel
- first activity
- product feature(s)
For example, product feature-based filter criteria for mobile computing device chargers could include ‘micro-USB’, ‘MagSafe’, ‘solar’, etc.
Any filters you’ve applied will appear in the bar above the leaderboard table.

The leaderboard table shows totals for product models that meet your chosen filter criteria, ranked according to units sold. Each column reports important sales data or feature information for models.
3. Analyse product data according to KPIs or features
To configure the product leaderboard data according to KPIs or feature information, click on the ‘Settings’ button situated next to the search box located at the top right of the leaderboard.
The settings button looks like this:
![]()
Then, select the KPIs or features you’re interested in.
Another way to isolate specific models for analysis is to use the search functionality. Do this by typing the model name into the search box located at the top right of the leaderboard.
4. Track product performance
The Product leaderboard allows you to track the performance of specific product models.
To do this, select any product name or model to explore data relating to revenue, volume, price, distribution, and additional product feature information. Hovering your mouse over the KPI trend lines will show you the values for the selected time period.

For each model, you'll see a list of key performance measures representing fluctuations in product performance based on your chosen time range. These performance measurements are presented either as a percentage (for example, 1.7%) or actual amount (for example, 380 units or €250.90).
Get granular product performance insights by assessing the following product performance measures:
- Revenue
Sales revenue (in your selected currency) for the model. - Units
Total units of the model sold. - Revenue/units share
Revenue/units sold for the model shown as a percentage of total revenue/units sold of all models. - Price
A weighted average sale price (in your selected currency) for the model. - Price index
Average price of a model in relation to the average price of all models in the market. - Selling shops
Total stores who sold at least one unit of the product in the focus period. - Active numeric and weighted distribution
Active Numeric Distribution is the percentage of eligible stores who sold one or more units. Active Weighted Distribution reflects distribution quality by accounting for the importance of each store within the product category. - Average revenue/units per shop
The total revenue/units sold for the model divided by the number of selling shops for the model. - Turnover share revenue/units
The market share of the model inside the shops which are selling that model. - First activity
The month in which GfK first observed POS data for the model.
5. Compare product performance against competitors
The Product leaderboard allows you to compare the performance of your products against the performance of competitors’ products.
To do this, use the checkboxes next to each product name to select the products you’d like to compare. You’re able to compare up to 15 models at a time. Once you’ve made your selection, click ’Analyse’ to compare features and sales performance.
Alternatively, use the ‘Analyse top 5/10’ quick links to see information for the top 5/10 models in your current view.

Features of your selected models can be reviewed in the table beneath the charts on these tabs. Spot the differences between them by simply ticking the ‘Show differences only’ checkbox.
![]()
Remember, you can review priority KPIs on the Scorecard tab, analyse longer-term trends on the Time series tab, or segment your data to gain a deeper understanding of what is driving performance on the Segmentation tab.
6. Create group of products
Create a group of products by selecting 2 or more products and clicking on the ‘Add to group’ button which appears at the bottom right of the page. A group of products aggregates all sales data of the added products, so you can analyse the market by series for example. Groups are always shown at the top of the leaderboard so you can easily add or remove products easily.

7. Export your data
Exporting data from the Product leaderboard is easy. Simply select Export, then choose to download your leaderboard or product analysis data as either an .xlsx or .ppt file.