See the factors that most drive purchase decisions for a brand or market, mapped against perceptions of the brand's performance in those factors.
What is it?
Our consumer survey measures how people perceive certain aspects of a brand—such as quality, innovation, or ease of use. These perceptions drive them toward shortlisting and eventual purchase of a brand’s product.
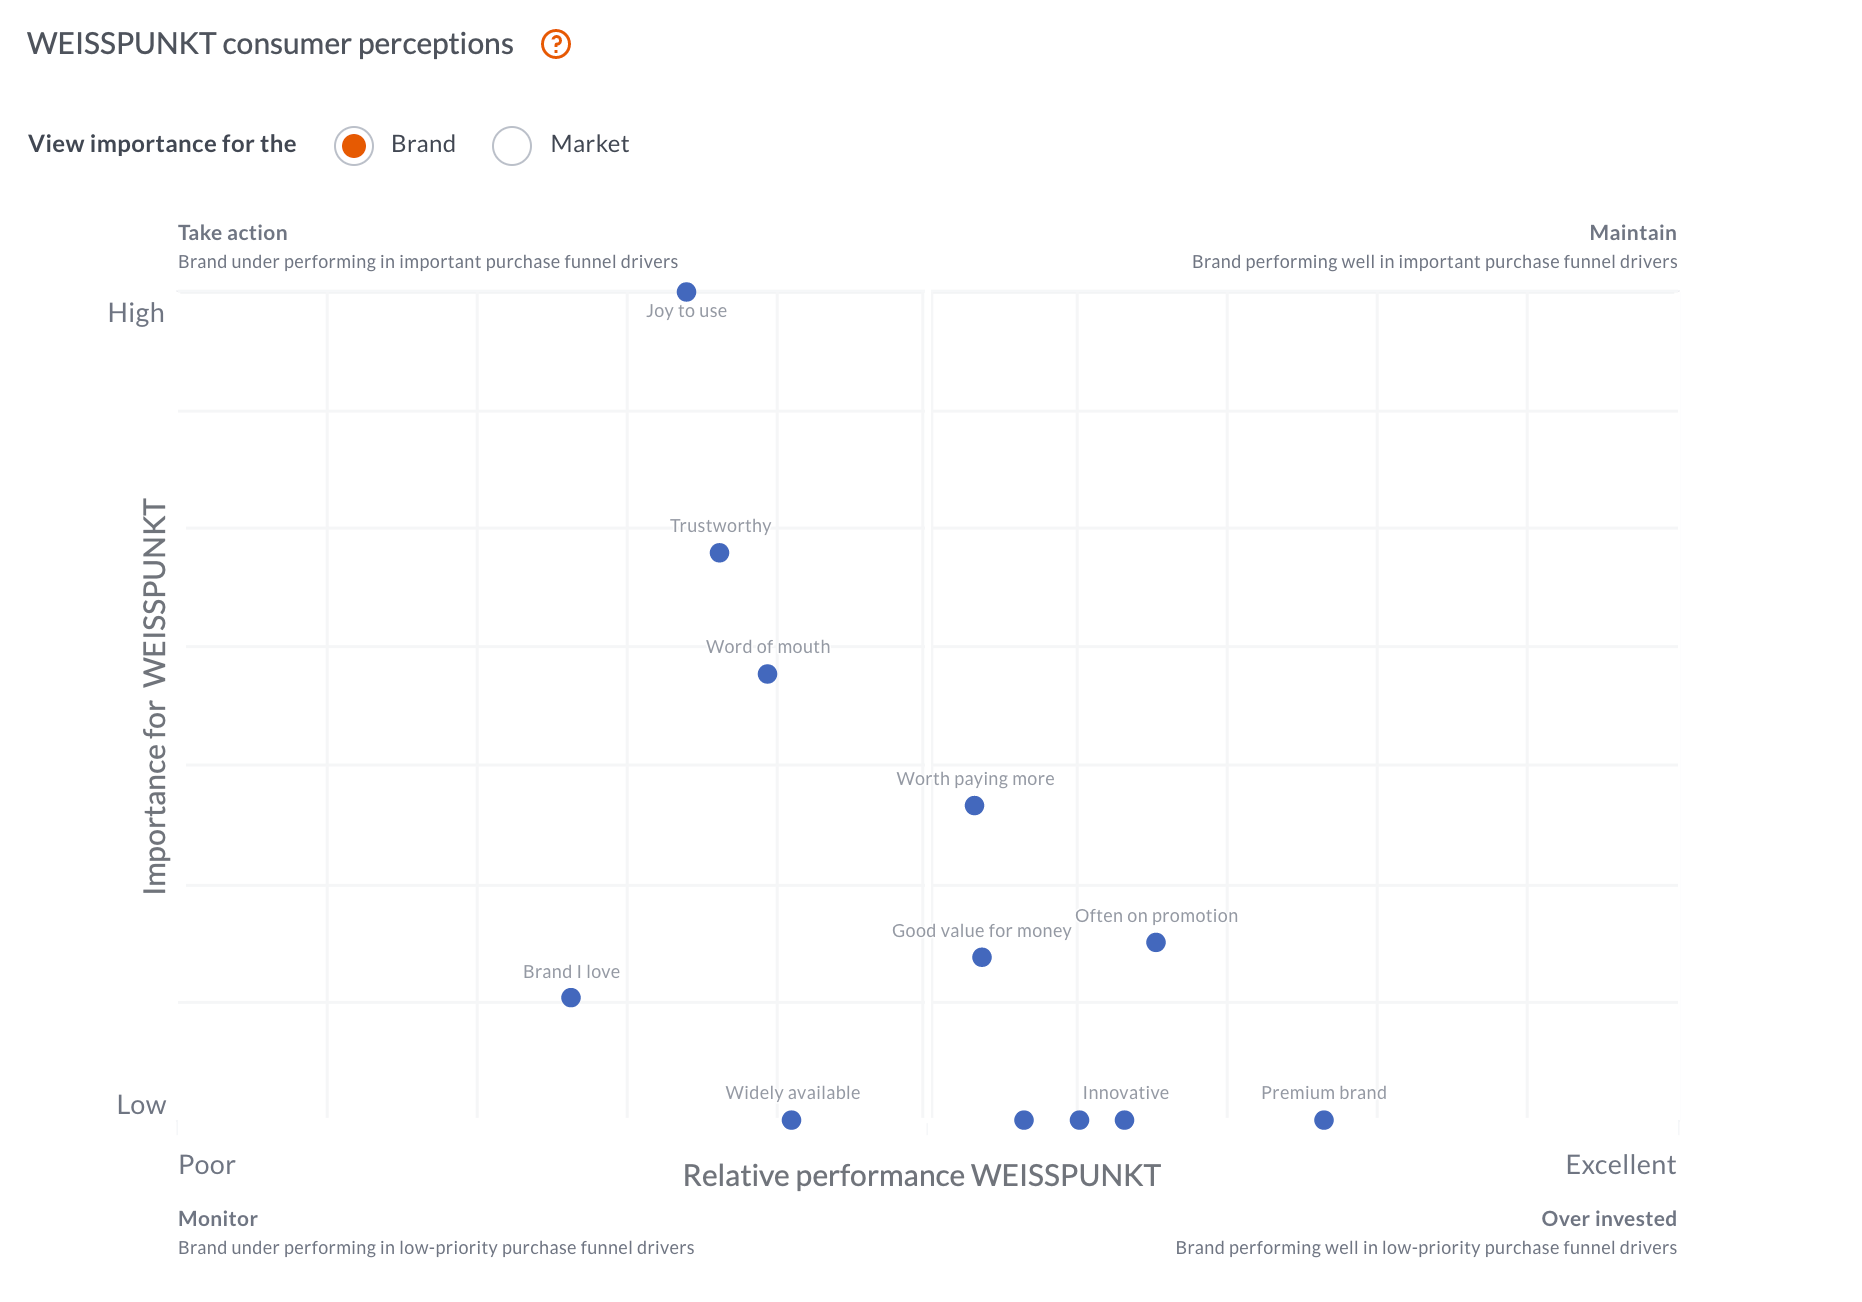
You'll see the considerations most important to a specific brand’s success, mapped against how well consumers perceive the brand to meet those criteria.
You can toggle from this brand-centric view to a wider market view. Here you’ll see the most important considerations that drive purchase decisions in the market, and how well consumers perceive each brand to meet their expectations.
Use both these views to plan your strategy for improving brand performance in those considerations that encourage people to buy.
How to read the chart
The chart shows a brand's relative performance in specific consumer perceptions against either the importance of those perceptions in the market, or the importance to the brand.
In both cases, this places net performance of each perception in one of four quadrants.
Take actionWhere brand perception is weak in factors important to the purchase funnel |
MaintainWhere brand perception is strong in factors important to the purchase funnel |
MonitorWhere brand perception is weak in non-essential factors |
Over investedWhere brand perception is strong in non-essential factors |
Alternative views
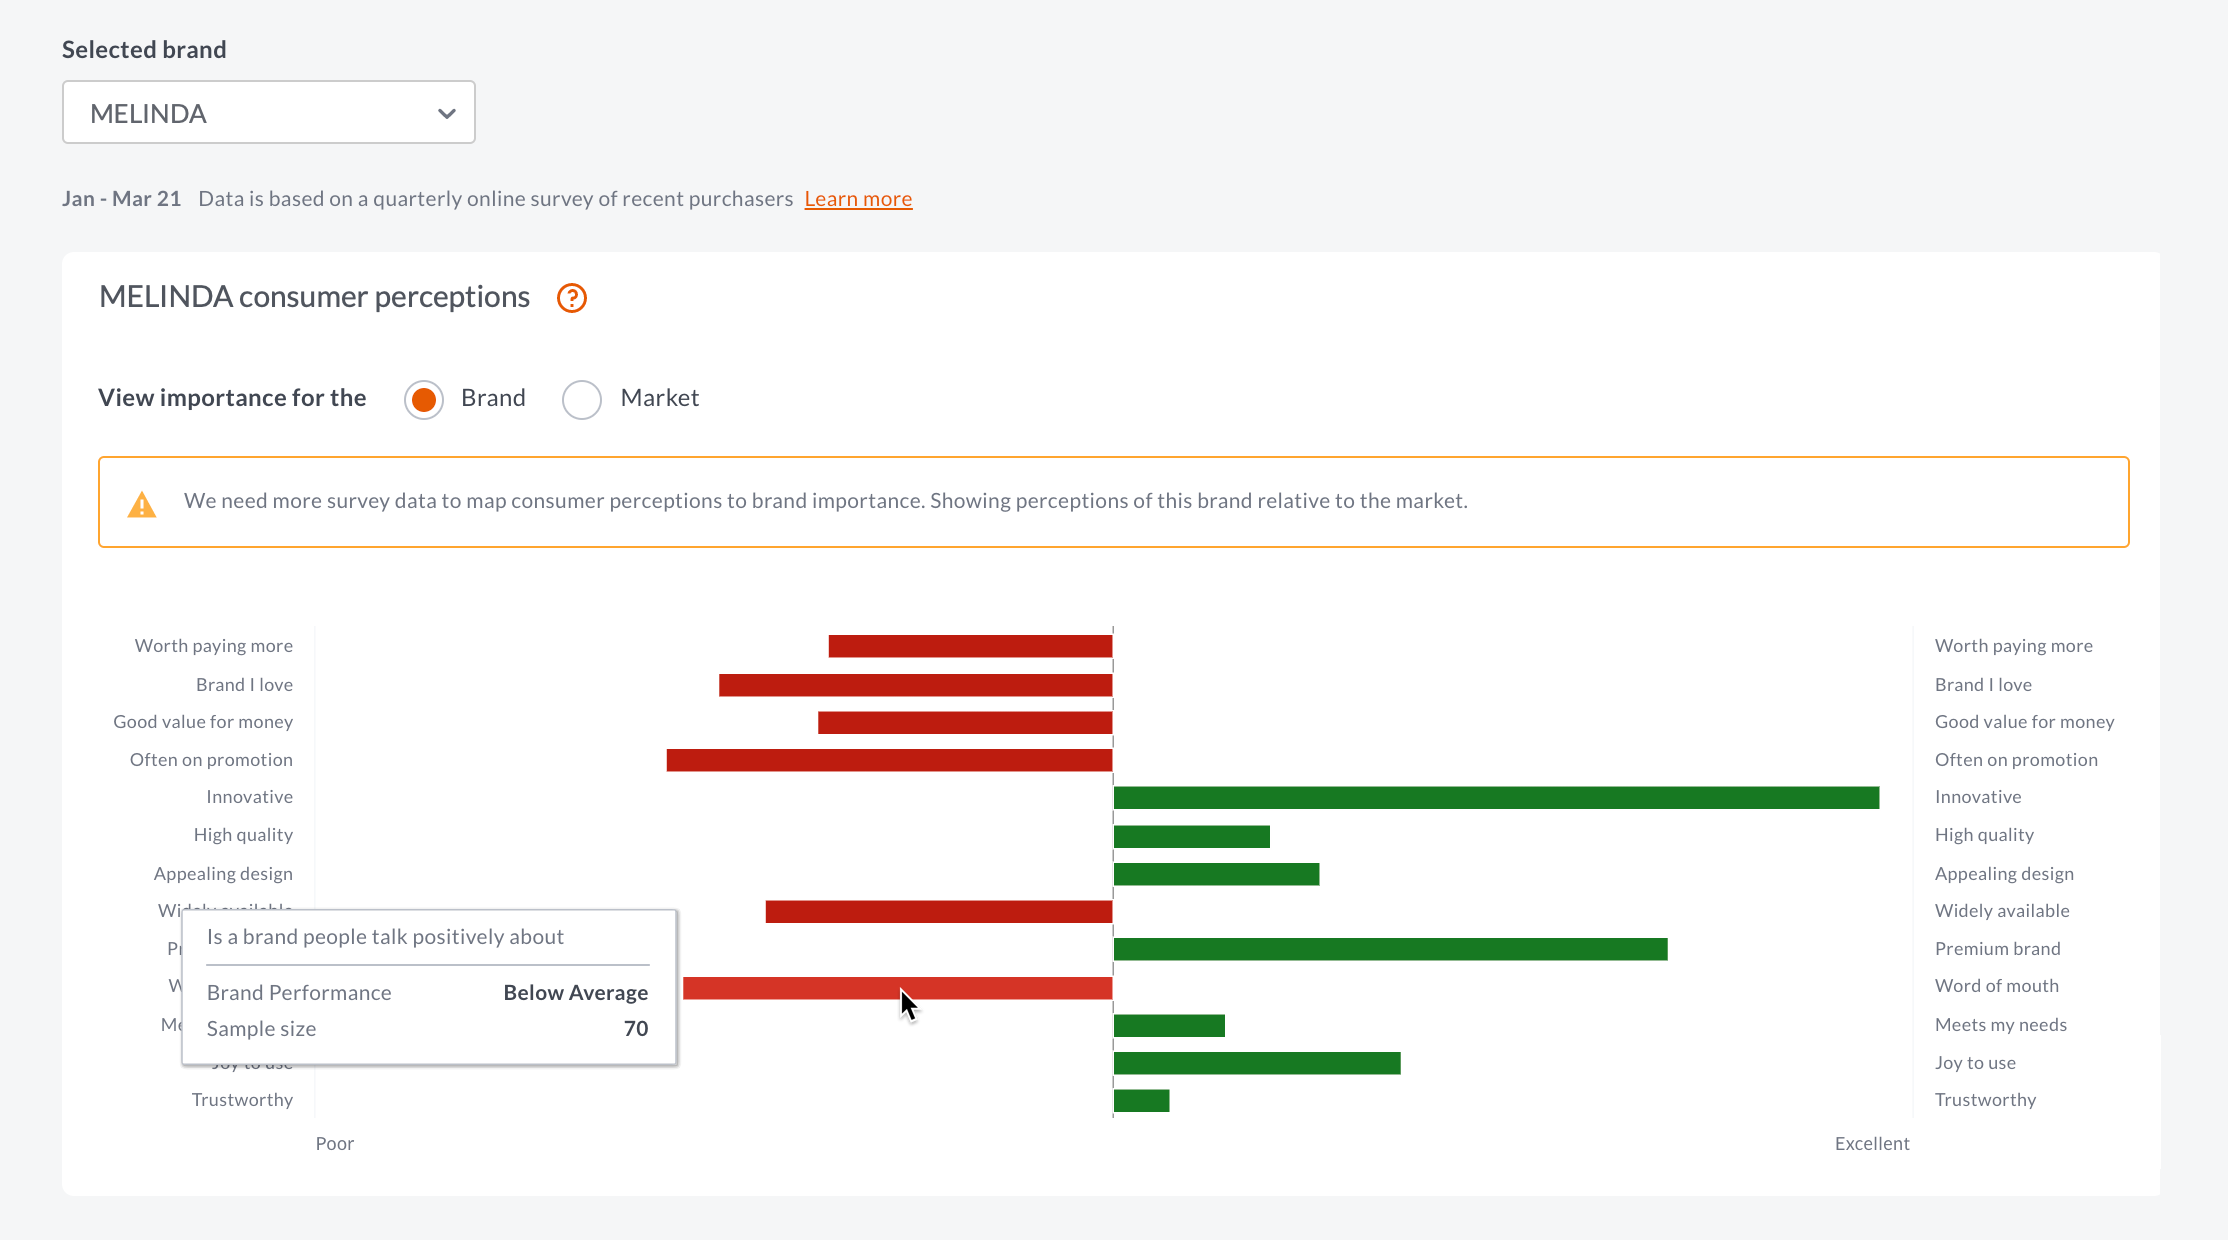
If a brand doesn't have enough survey data to accurately map perceptions to importance, we may show instead performance in perception statements relative to the overall market. Hover over any value to see how the brand performs against the market average.
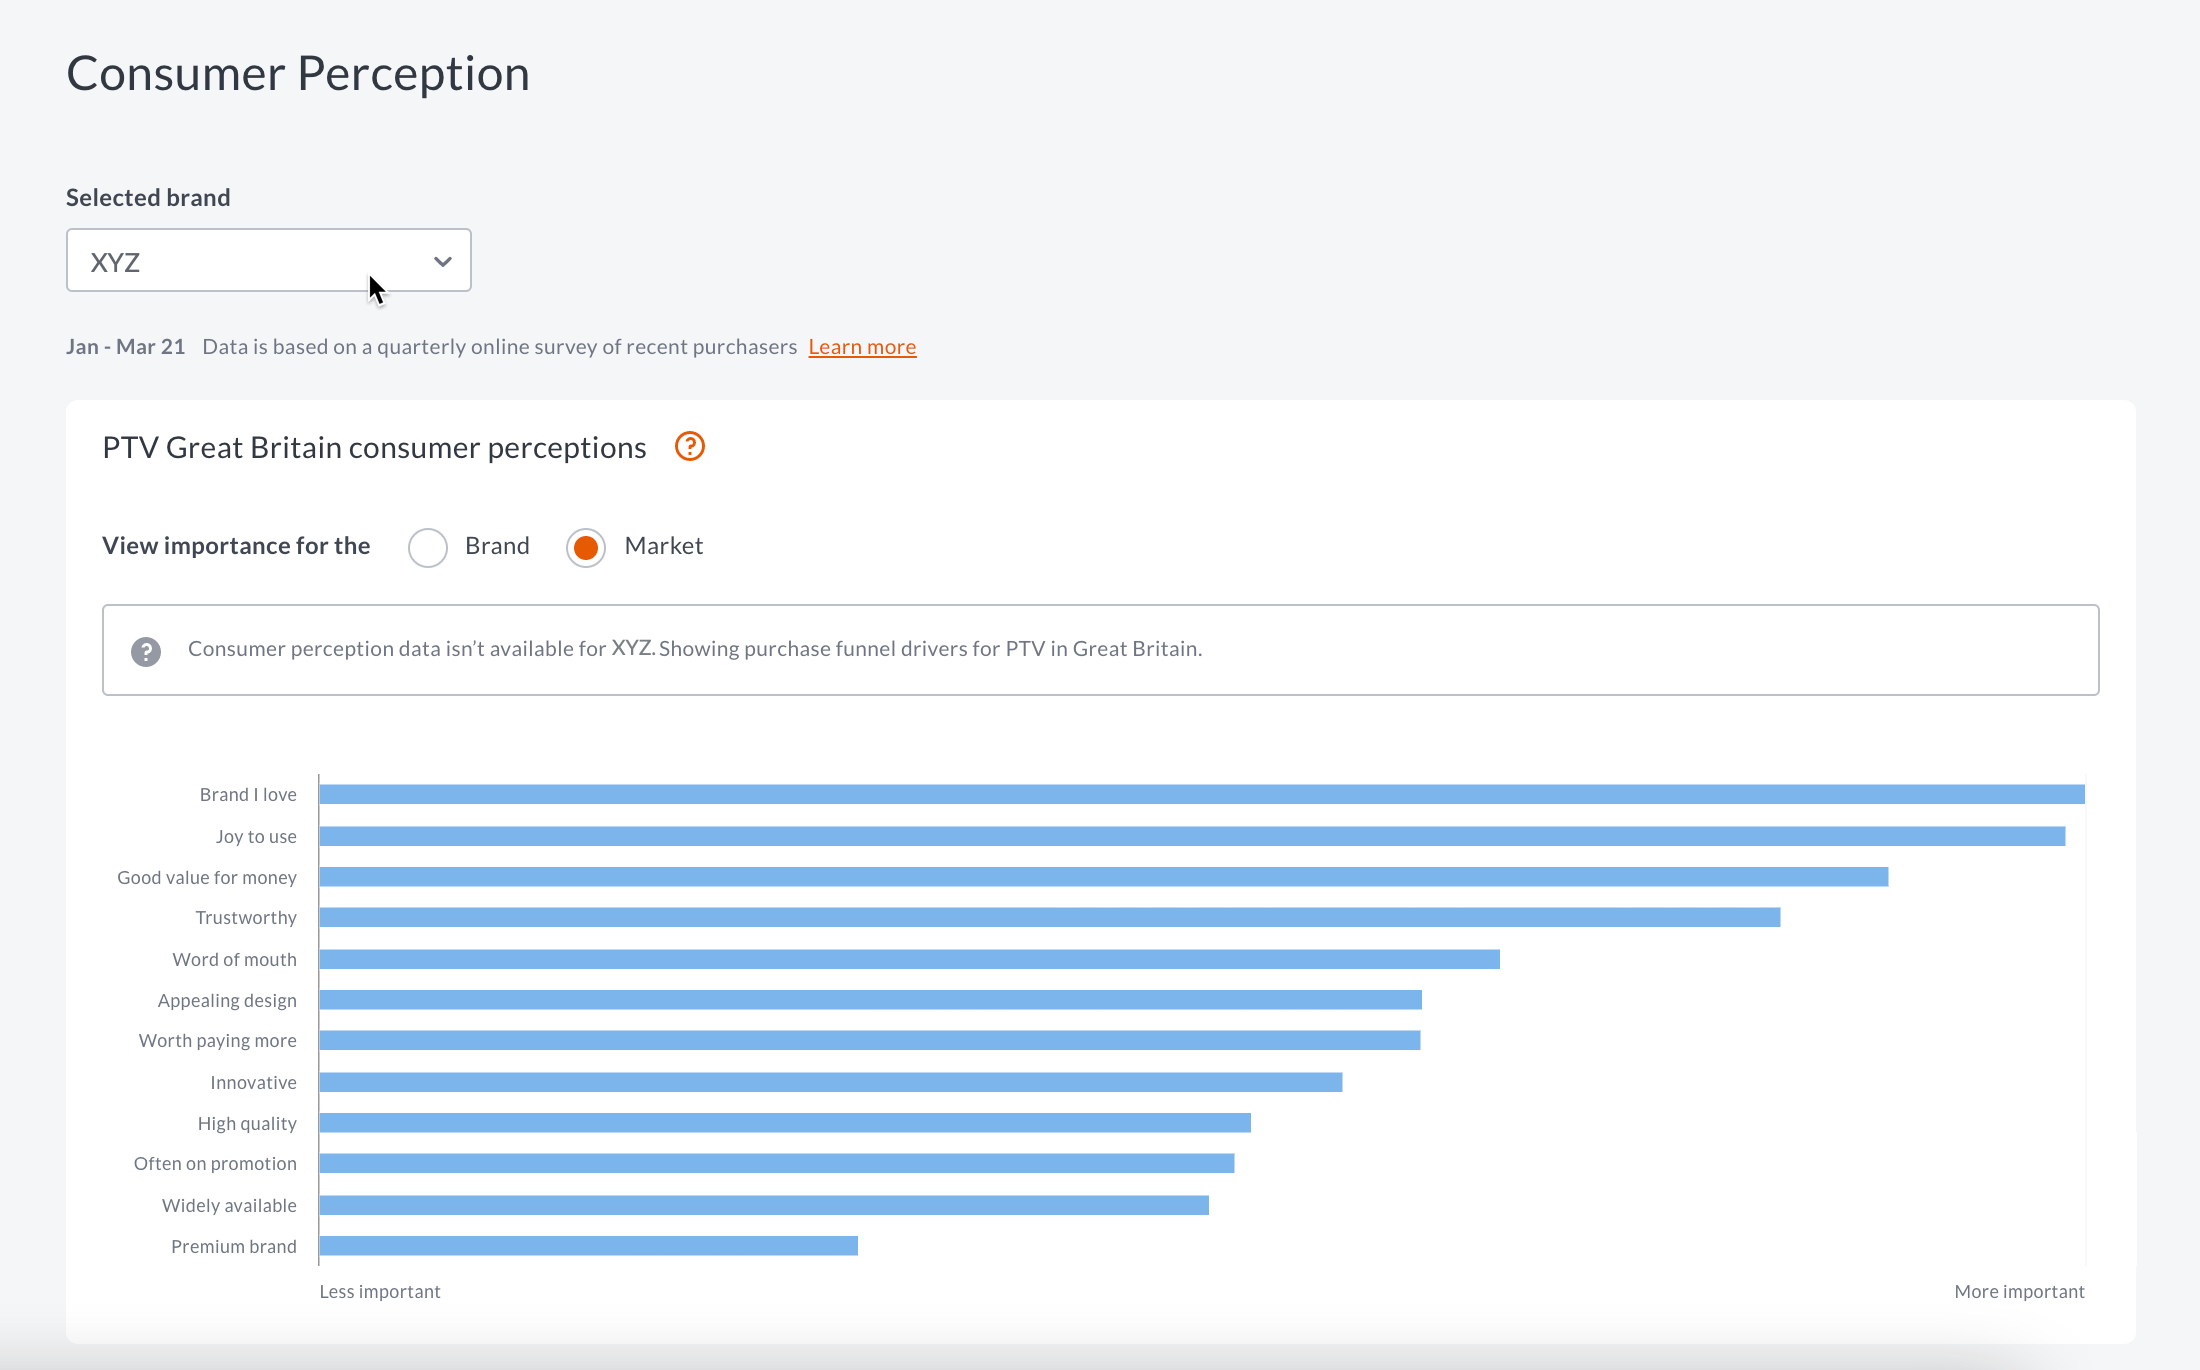
For brands with no consumer survey data, we'll rank the purchase funnel drivers for the market.

How we work it out
We use machine learning to weight the importance of perception statements when consumers shortlist a brand.
Consumer perception scores for each brand are normalised to identify relative performance.
The consumer perception survey
Perceptions are sources from quarterly survey data of recent purchasers in each market. People were given a list of brands and asked to associate them to each of these statements:
- Worth paying more for
- A brand I love
- Good value for money
- Often on promotion
- Has products with the latest innovation
- Has high quality products
- Has products with an appealing design
- Available in stores I usually go to
- A premium brand
- A brand people talk positively about
- A joy to use
- A brand I trust


