Track conversions along the consumer purchase journey. See how many browsers of your brand go on to actually buy.
What is it?
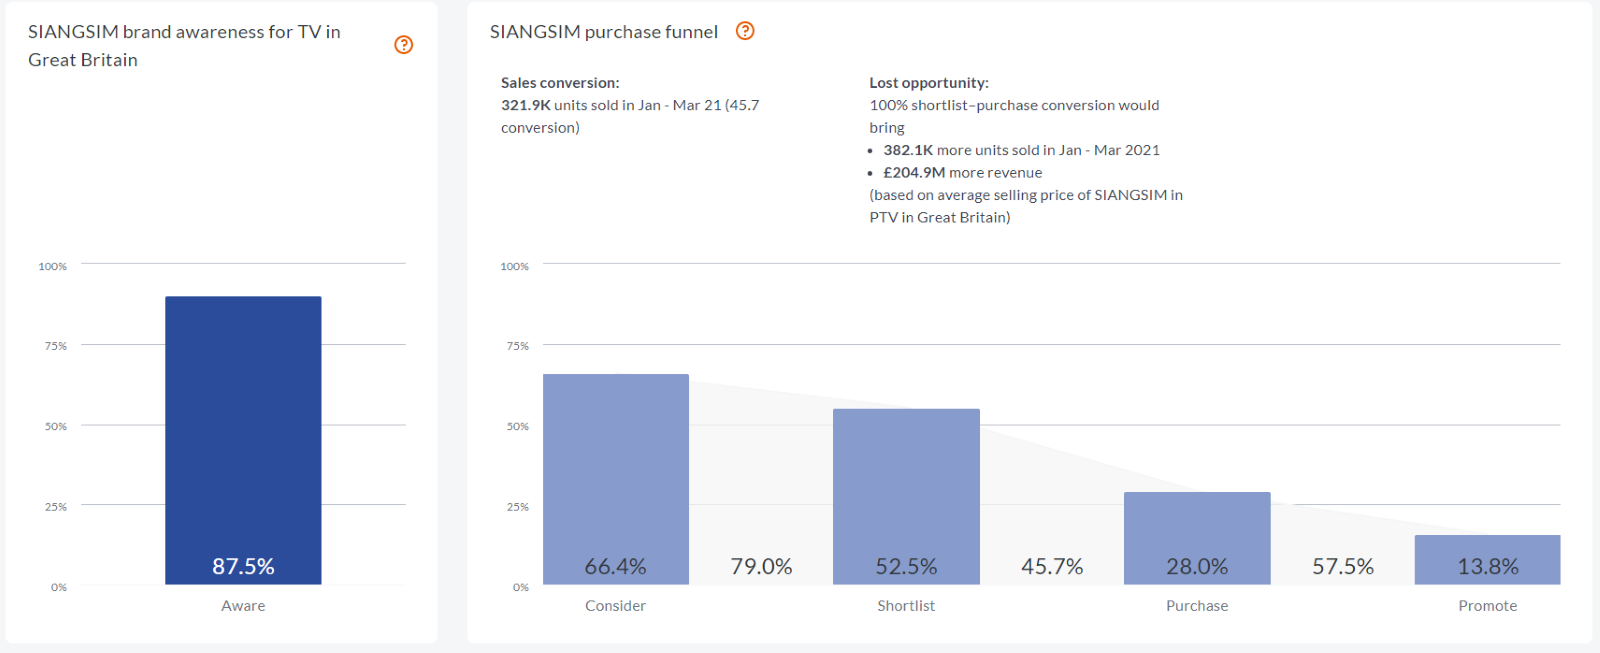
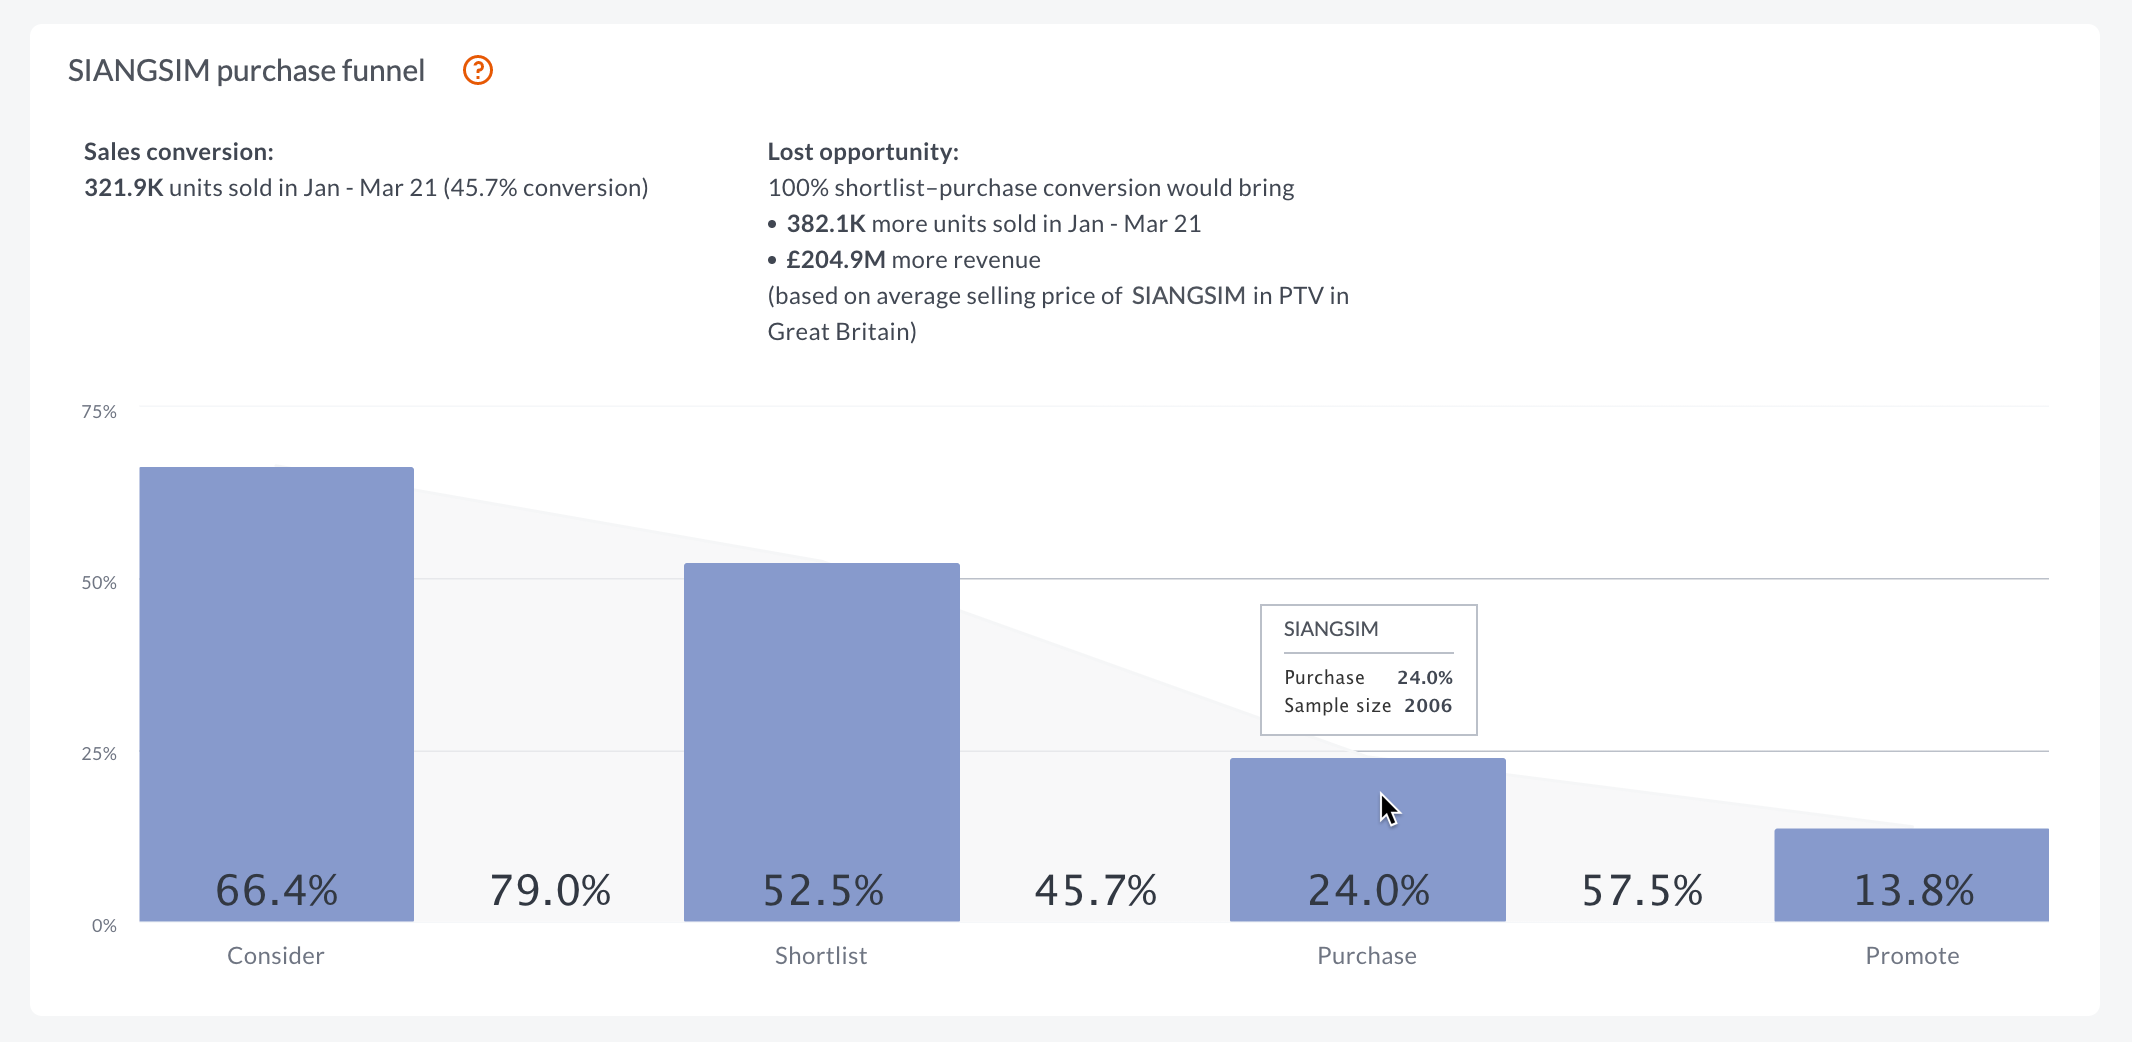
The Purchase Funnel shows a brand's performance at each stage of the purchase journey along with the conversions between.
What can I do with it?
Based on a survey sample, get a picture of the drop-off as consumers move from considering a brand, then shortlisting, actually purchasing the brand's product, and even going on to recommend it to others.
Consider
The percentage of survey respondents who considered the brand. People were asked:
Thinking about the whole process, which brands did you consider apart from the brand you purchased?
Shortlist
The percentage of survey respondents who shortlisted the brand. People were asked:
In addition to the brand you purchased, which of these were your preferred options in the end?
Purchase
The percentage of survey respondents who actually purchased the brand People were asked:
What brand did you buy?
Promote
The percentage of survey respondents who purchased and would recommend the brand. Purchasers were asked:
How likely would you be to recommend the brand to a friend or colleague?
Brand conversion rates
These show how many people convert from one stage of the purchase journey to the next.
For example, if 69% of survey respondents considered the brand and 57% of those people went on to shortlist, this represents a conversion rate of 82%.
Brand awareness

The Brand awareness chart shows the percentage of surveyed consumers who said they’re aware of this brand.
The surveyed category may cover more than one market. For example, ‘Built-In Hobs in Germany' and ‘Cooking in Germany’ are part of the ‘Cooker/Oven/Hob in Germany' category.
If no brand awareness data is available, a message will appear explaining this. A value of zero percent indicates none of the surveyed consumers had heard of the brand.
Purchasers were asked:
Which of the following brands are you aware of?

