Predict+: TPR Simulator
Identify the impact of discounts on sales volume, revenue and profit for a product model and its brand.
Using the TPR Simulator
To reach the TPR Simulator, select Promotion Planning from the main menu then use the Promotion Planner to find models likely to benefit from a temporary price reduction. Select any model from the results to open the TPR Simulator.
Got a specific model in mind? From Products, select a model name to open up its details and then select the Price & Promotion tab to see historic TPR trends. From here, select Run TPR Simulation to open the simulator for your selected model by selecting Go to Simulation.
The TPR simulator is a powerful tool that supports you in answering important questions when planning your next promotion such as:
- How much volume and revenue uplift would be generated by different discount levels?
- Which other models from my brand are affected when I price discount a certain model?
- How would these translate into volume and revenue uplifts for my brand?
- Which competitor models can I target with a price promotion?
How to read the TPR Simulator table
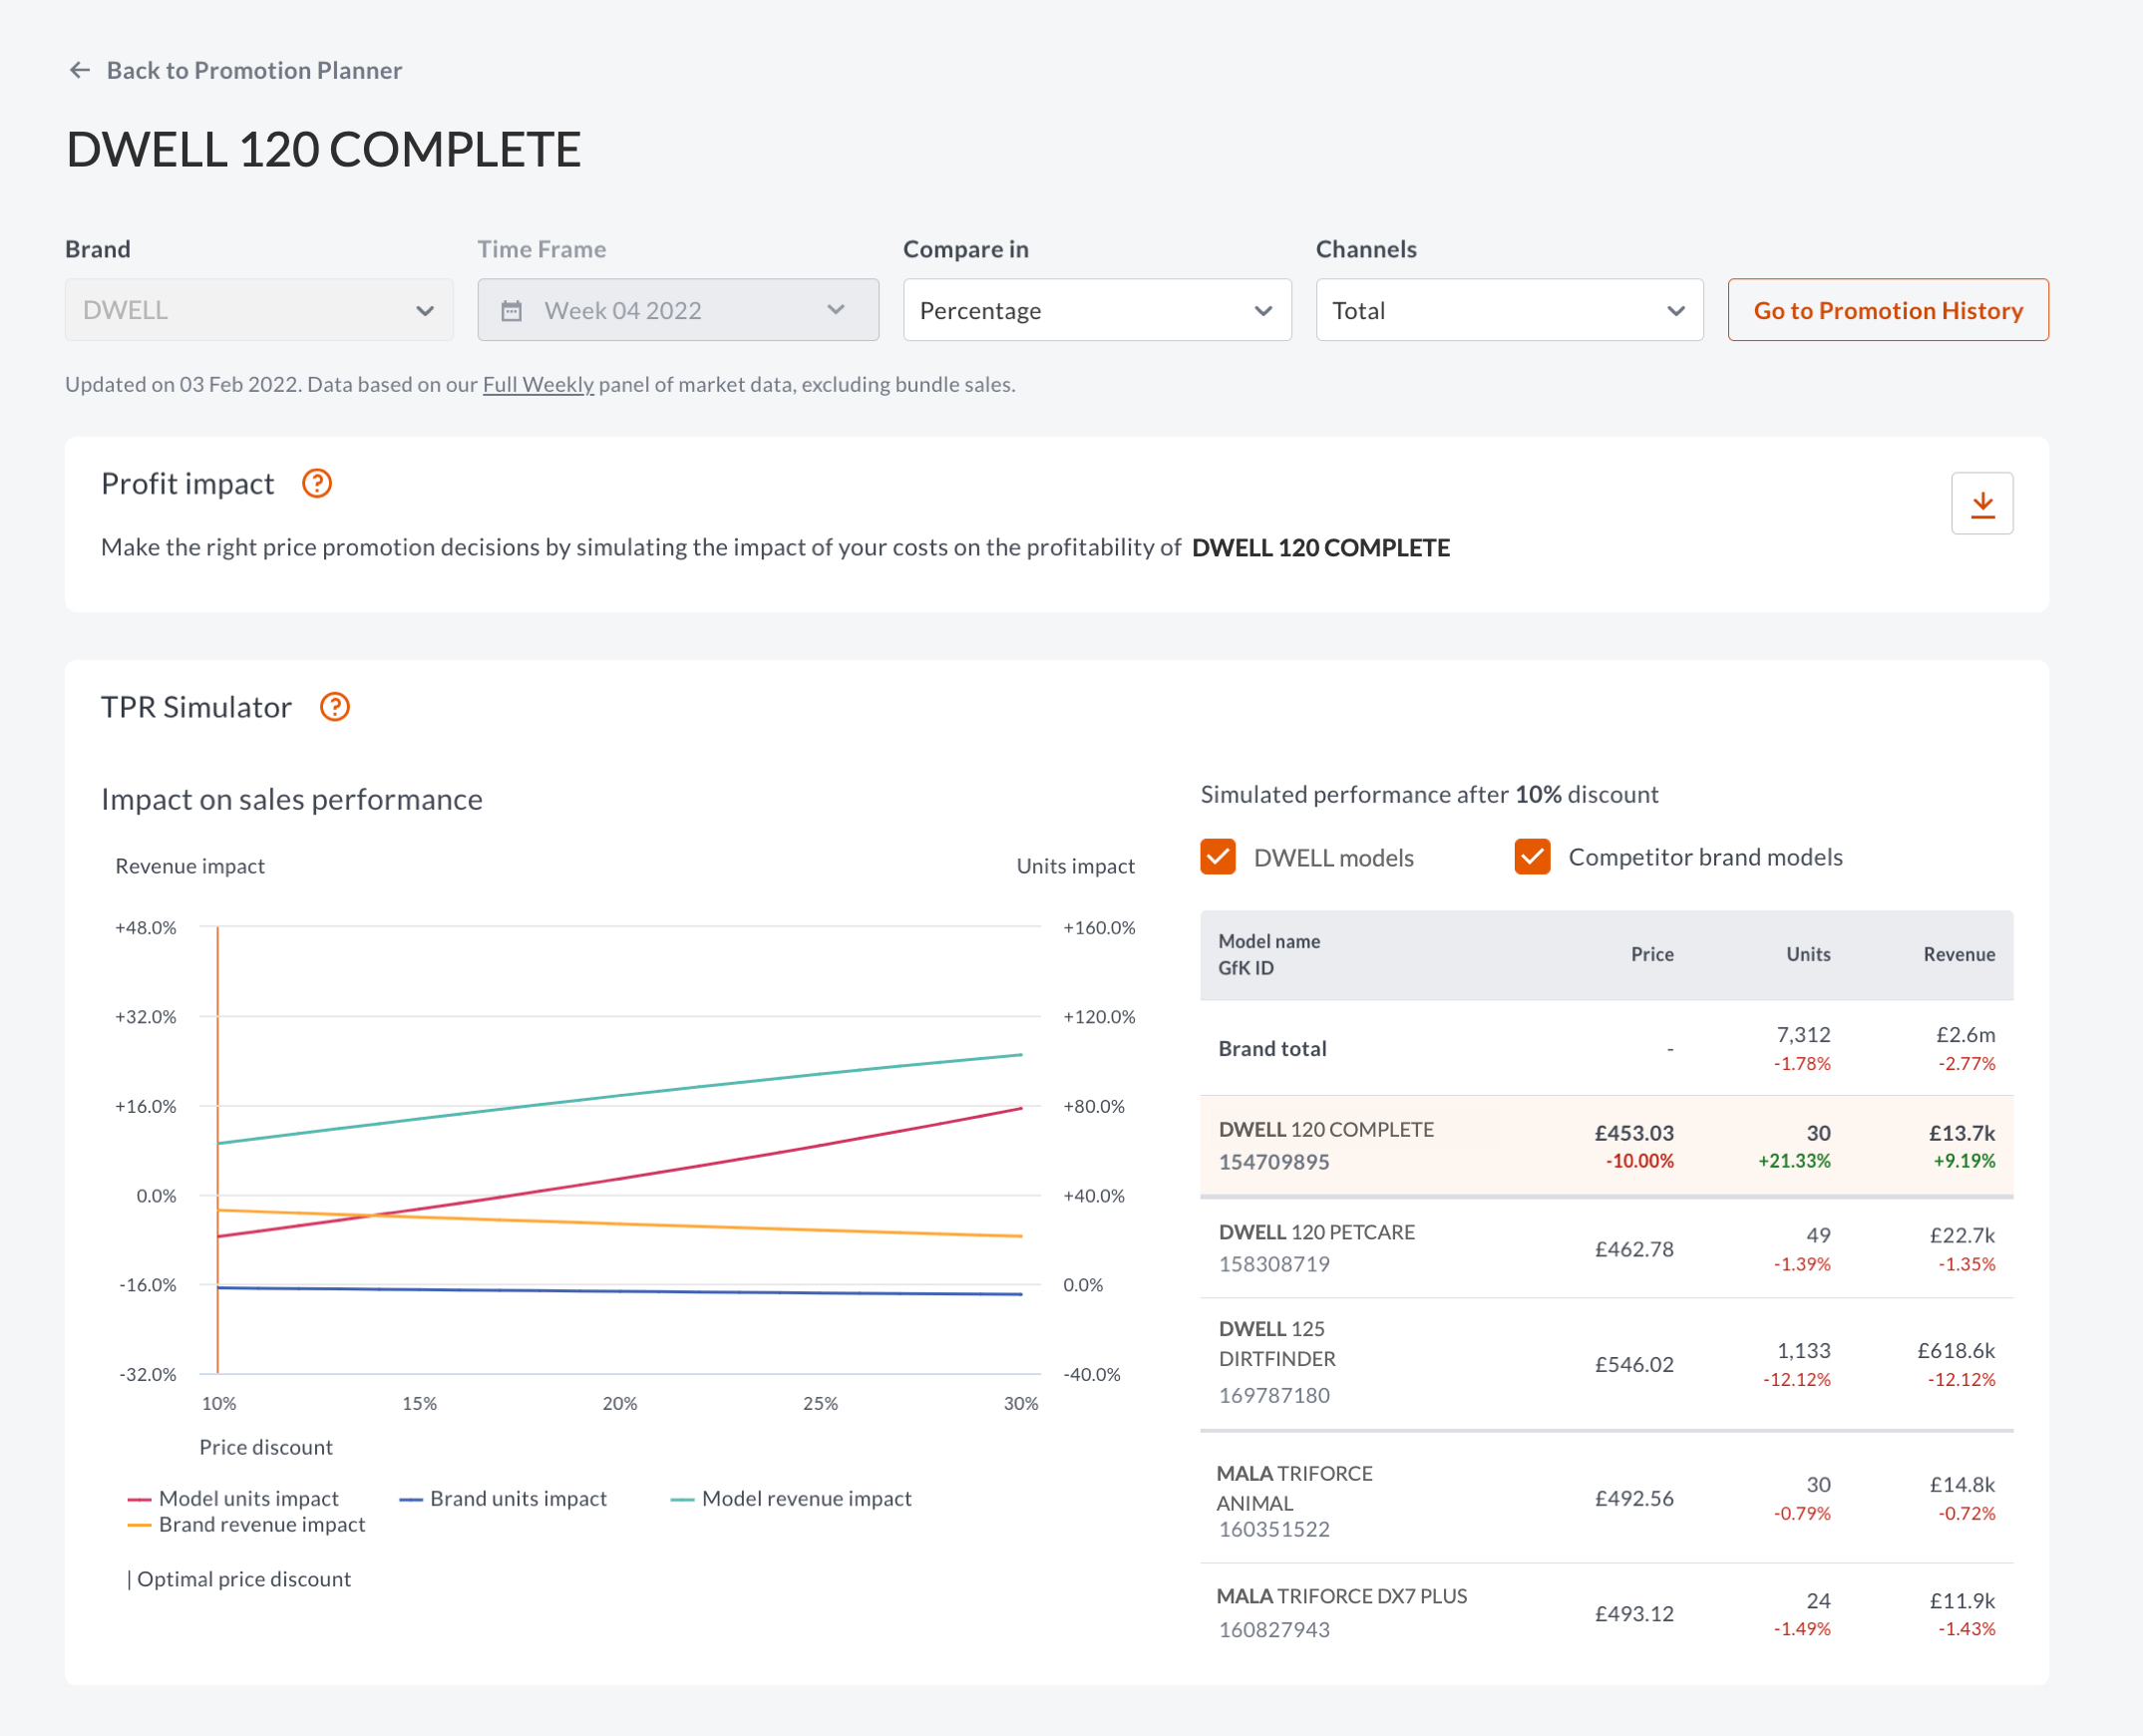
The table answers these questions, helping you figure out how a price promotion (at a selected discount) would impact the number of units sold and the revenue generated for a specific product.

If you're looking to run a price promotion on one of your products, the table helps you understand how it will impact sales of other products in your brand. It shows the net impact on units sold and revenue of your promotion, as well as competing products likely to be impacted.
How to read the TPR Simulator graph
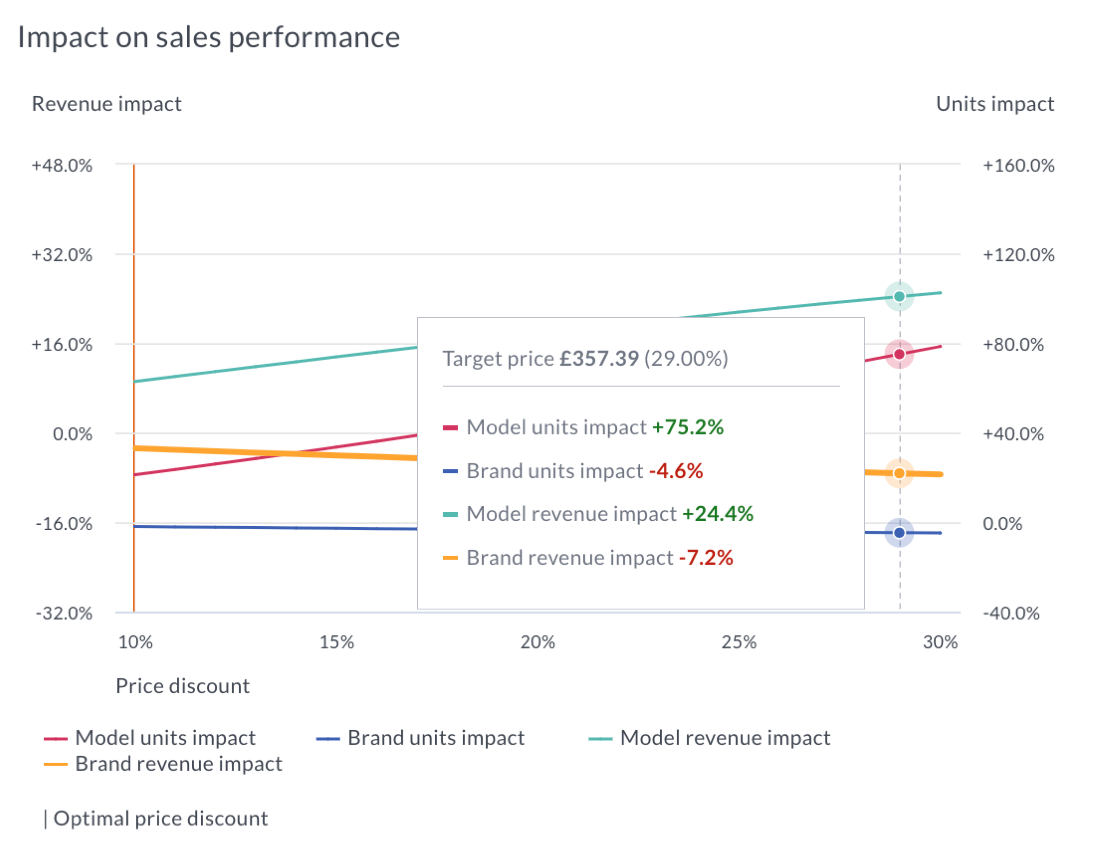
Select any value on the graph to see how a target discount affects sales and revenue, for both the model and the brand.

This example highlights a 29% price cut simulation, applied in the Total (Online + Offline) channel. The results show the simulated prediction of the sales performance in the past week, had the price cut been applied.
In this example, it shows an 75.2% increase in units would have been sold, with an incremental model revenue gain of 24.4%.
Profit Impact
The simulator graph and table show how price promotions would impact your brand's volume and revenue, and any impact on your competitors. With Profit Impact, you can extract this data and add your own cost information to see how much profit you could potentially make from discounting a specific product model. Figures can be simulated both for your organisation and your retailers.
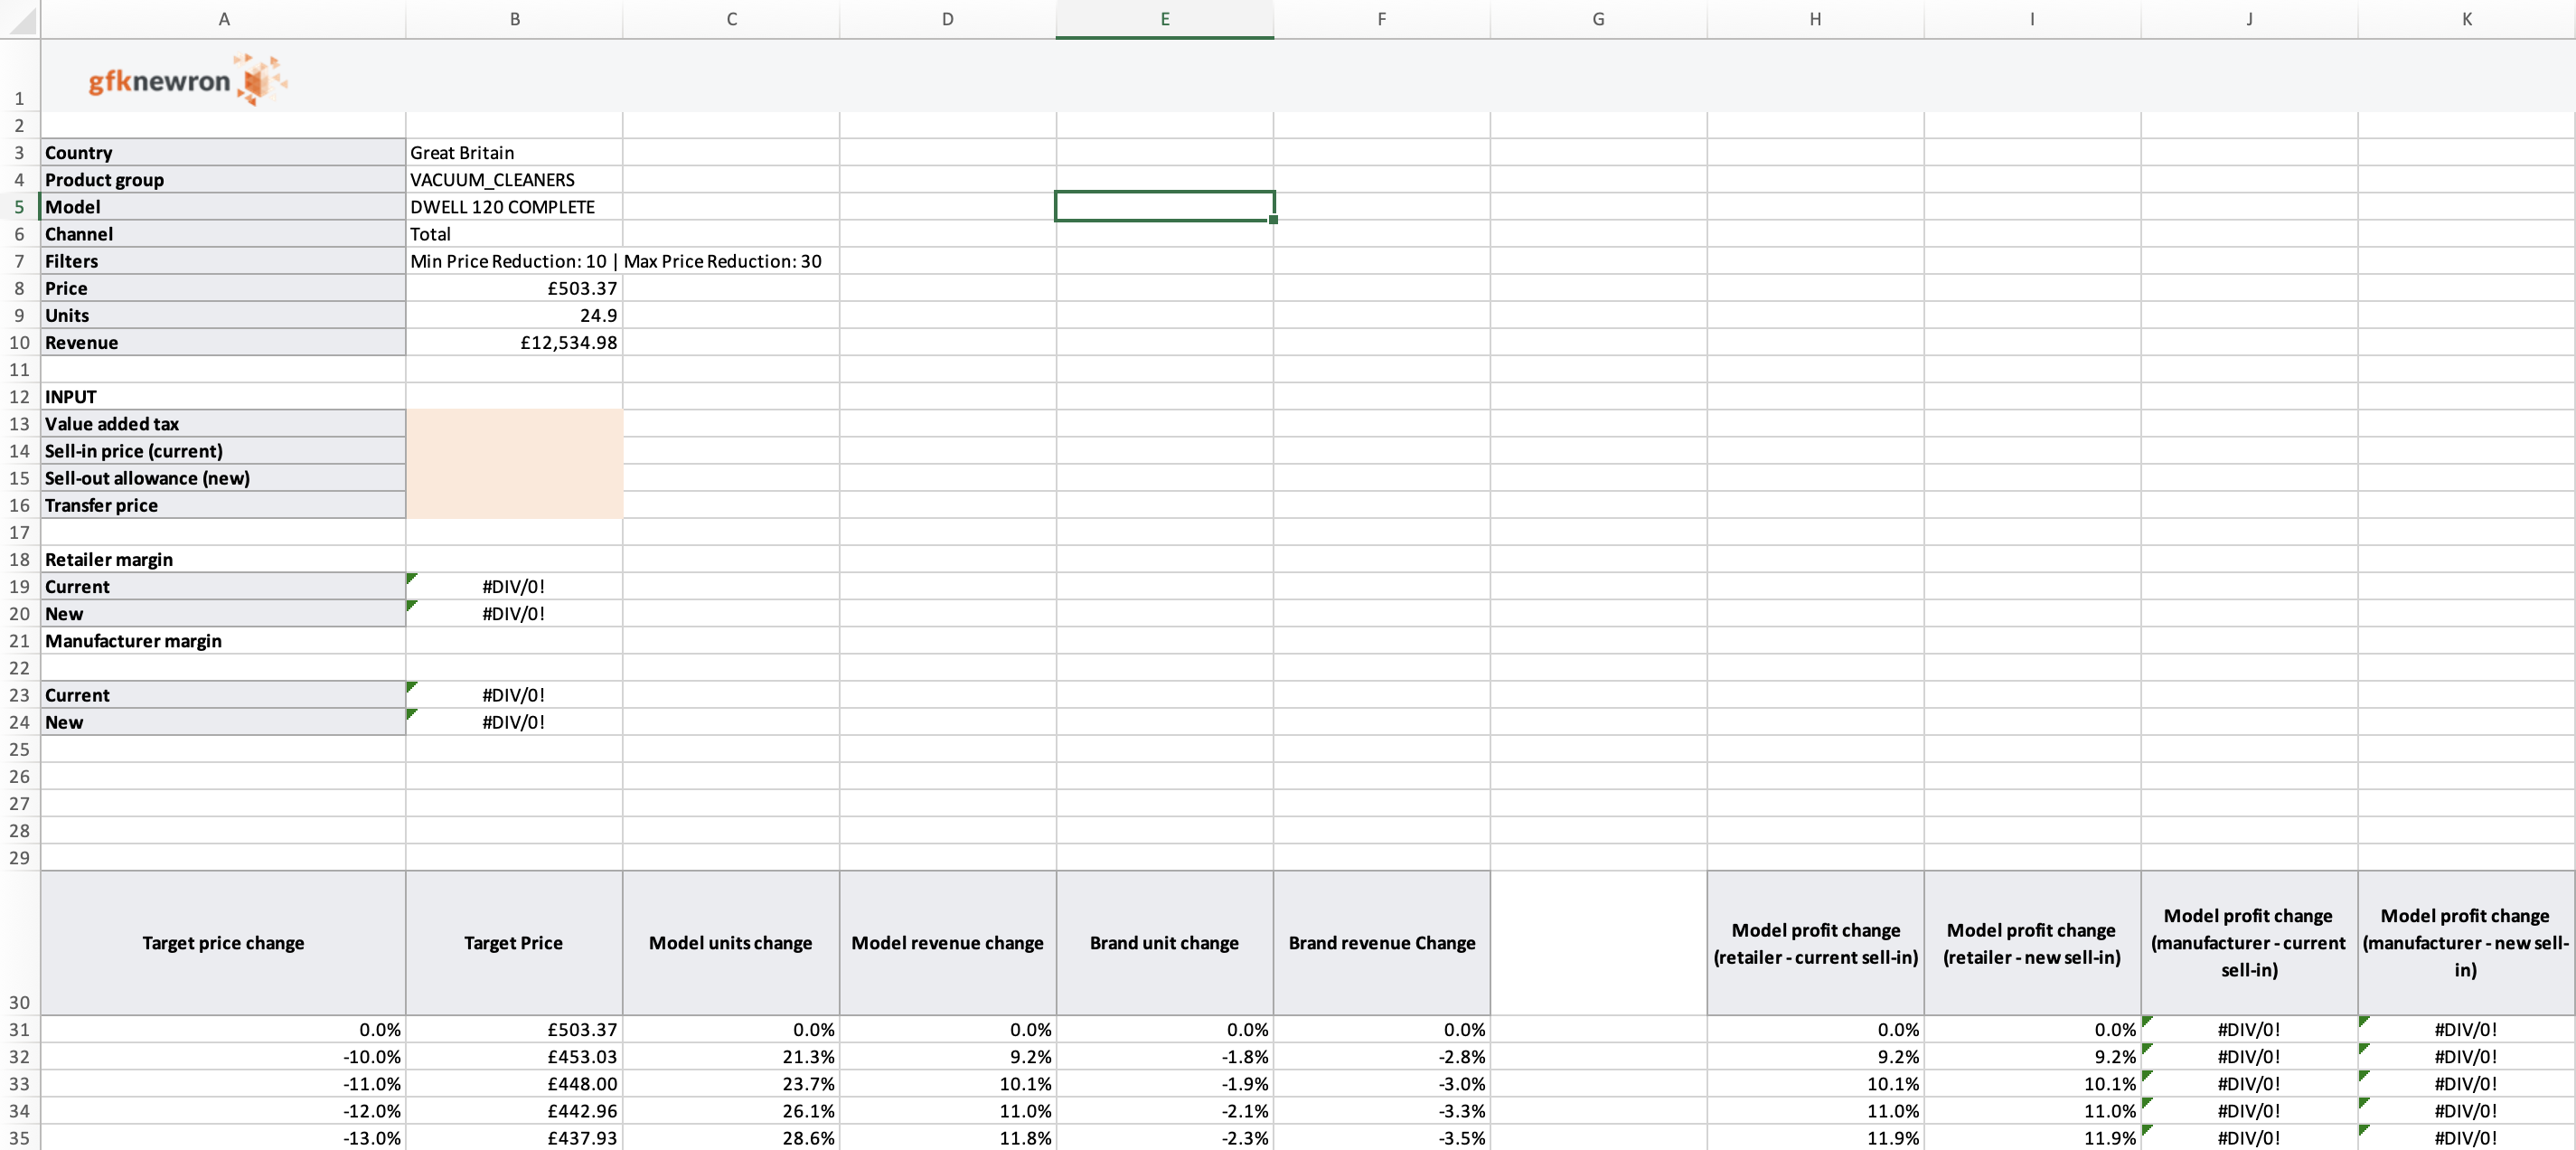
Use the downloadable .xlsx spreadsheet to explore how different levels of sell-out allowance impact manufacturer and retailer profits. This helps you plan more profitable promotions and increase the ROI of promotion activities.

The spreadsheet includes input fields for regional value-added tax, sell-in price, sell-out allowance and transfer price, and calculates how these (as well as promotion volume uplifts) affect a model's profit.

You'll see how different discounts will impact the retailer's and your own profits so you can negotiate pricing to ensure both manufacturer and retailer maintain profitability.
How we work out the simulation
The TPR simulator trains a log-linear fixed effects sales model which uses up to 52 weeks of POS data to learn impacts of temporary and permanent price reductions of own and competitor brand models on your sales. It uses POS sell-out data to simulate the effect of sell-out price reductions on sell-out units.
Simulated impact is based on the latest week's sales data. Calculations represent the average effects of past TPRs and consider distribution effects implicitly. The simulator answers what would have happened in the reported week if the model had been offered at the selected level of price reduction.
We assume current market behaviour to be comparable to past performance. Reactions of competitors to price reductions and market movements are not factored into the simulation.
Channels are available based on your subscription. In some cases, channels may be removed if the data doesn't pass our quality checks.
Bundles: Where applicable, known bundles sales are excluded. Bundles are defined as a combination of multiple products sold together at a single price, such as a soundbar sold together with a TV. Contact your local GfK representative for more information.
The simulation uses up to a year's worth of sales data to learn the likely impact of promotional discounts. It accounts for effects on other brand models and can show the impact on competing models.
Get the most accurate results when you stick to discount ranges you've used before.
Terminology
Transfer price is the purchase cost of a unit from the factory. Usually this is paid from the country organization to the headquarters.
Sell-in price is the price the product is sold to retailer
Sell-out allowance is sales incentives offered to the retailer
TPR is Temporary Price Reduction which is defined when a product's price is reduced by 10% for up to four weeks. After four weeks we classify it as a permanent price change.

