

Using performance drivers
Combining information from the Revenue Premium Market Landscape chart, with information from Segmentation pages, Performance Drivers helps you gain a deeper understanding of your overall revenue premium performance versus that of your competitors.
The page is accessed via the link in the left-hand sidebar. On this page, you can choose a Brand and a Competitor to compare it against. This can be refined further by applying Time Frame, Channel, or other filters to the data.
At the top of the page, you are shown a summary card showing an overall comparison of how your brand has performed against a competitor for the selected period.
Beneath this are the segment cards. Here, by default, you are shown your weakest through to your strongest segments by relative performance to your competitor. This order can be reversed using the ‘Sort by’ dropdown menu.
The currently supported segment options are:
- Price segments
- Feature segments
- Online/offline segments
How to read the summary cards
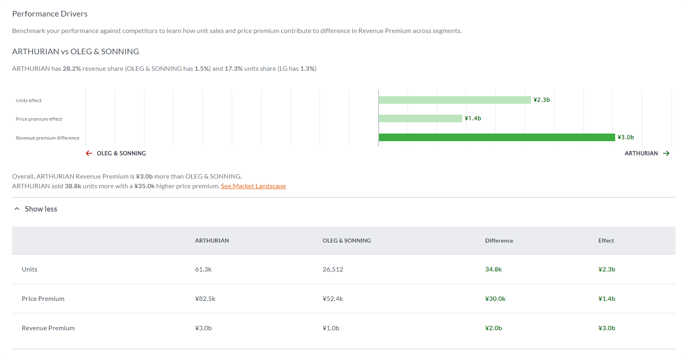
The summary card illustrates how differences in total units sold and price premium have contributed to the overall difference in revenue premium between you and your competitor.
Differences in revenue and unit share, overall difference in revenue premium, and differences in units sold and price premium are presented in clear, simple statements above and beneath the summary chart. The ‘See Market Landscape’ link takes you to the Revenue Premium Market Landscape page, so you can get a broader view of the market and the relative positions of the brands operating in it.
Performance of the competitor brand is shown on the left-hand side of the chart, with your brand’s performance shown to the right. Thus, values on the left of the chart represent an underperformance relative to your competitor, while values on the right represent an overperformance relative to your competitor.
The units effect and price premium effect values illustrate how the differences in units sold and price premium obtained between you and your competitor contribute to the overall difference in the revenue premium value. (See ‘How is it calculated?’ for more information.)
Clicking the ‘Show more’ link beneath the chart, reveals a data table showing you the raw numbers behind the chart.
How to read the segments cards
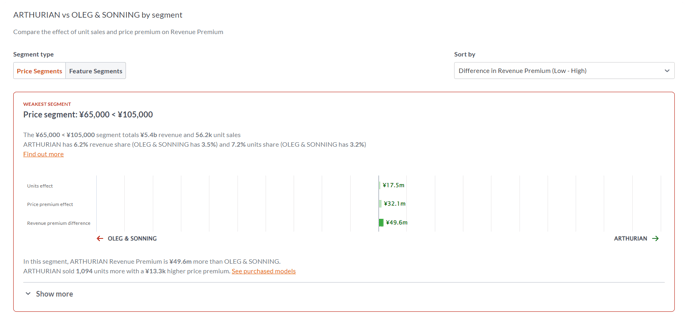
The segments cards illustrate how differences in units sold and price premium for individual segments, have contributed to the overall difference in revenue premium between you and your competitor. A clear label at the top of the card tells you if you are viewing the weakest or strongest performing segment relative to your competitor.
Total market value of the segment and units sold is presented at the top of the card to help you assess its relative importance to your business. Differences in revenue and unit share, overall difference in revenue premium, and differences in units sold and price premium are presented in clear, simple statements above and beneath the segment chart. The ‘Find out more’ link takes you to the associated segmentation page, e.g., price, so you can get a broader view of the market and the relative positions of the brands operating in it. The ‘See purchased models’ link takes you to the product leader board for that market so you can carry out deeper analysis to determine which individual products are driving performance.
Performance of the competitor brand is shown on the left-hand side of the chart, with your brand’s performance shown to the right. Thus, values on the left of the chart represent an underperformance relative to your competitor, while values on the right represent an overperformance relative to your competitor.
The units effect and price premium effect values illustrate how the volume of units you have sold and the premium in price you have obtained in doing so, contribute to your overall revenue premium value. (See ‘How is it calculated?’ for more information.)
Clicking the ‘Show more’ link beneath the chart, reveals a data table showing you the raw numbers behind the chart.
How is it calculated?
Units effect represents the element of the revenue premiumdifference that we apportion to the difference in the units sold by you and your competitor. It is calculated by taking the average price premium of your brand and the competitor, then multiplying this by the difference in units sold.
Price premium effect represents the element of the revenue premium difference that we apportion to the extra margin on your sales price attributable to the strength of your brand's perception in the market vs. the one of your competitor. It is calculated by taking the average number of units sold by your brand and the competitor, then multiplying this by the difference in price premium.
Revenue Premium measures income achieved due to a brand's market position. It’s based on factors as diverse as how consumers view your brand, feature differentiation, the promotions you run, even the terms of your warranty.